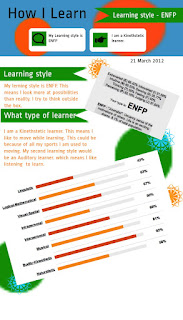
Infographics have been popping up for some time now online and in the news. These graphics are a great way to present information in an easy to understand and visually engaging way.
Students have been assigned to create an infographic aimed to share who they are as a learners. This will serve as the cover page for their Student Learning Plan. It is intended to be dynamic snapshot of the learner that can be altered and added to through the year.
Our grade 7's have created some excellent examples. They have been exploring their learning styles and discussing what are their strengths and challenges. This information is then summarized and put onto the infographic as a graphic, short paragraph, or some other visual representation of the data.
Many students have found Piktochart and Eas.ly to be an intuitive tools for creating the infographics. Some students have created their infographics from scratch in Pages as well.
As we collect more information about ourselves as learners over the course of the year and beyond, our infographics should grow and change with us.
Student Example 1
Student Example 2
Student Example 3


1 comment:
Your blog highlights the significant potential for engaging students in taking responsibility for identifying their areas of strength and strategies for growth as learners through the development of a learner profile/growth plan. The involvement of the students in sharing what they learn about themselves through infographics and the use of various intuitive tools is very impressive. The student exemplars are effective in demonstrating what they have learned about themselves.
Post a Comment